bluetape4k-dependencies 1.3.0 in Practice Part 3: Production Signals
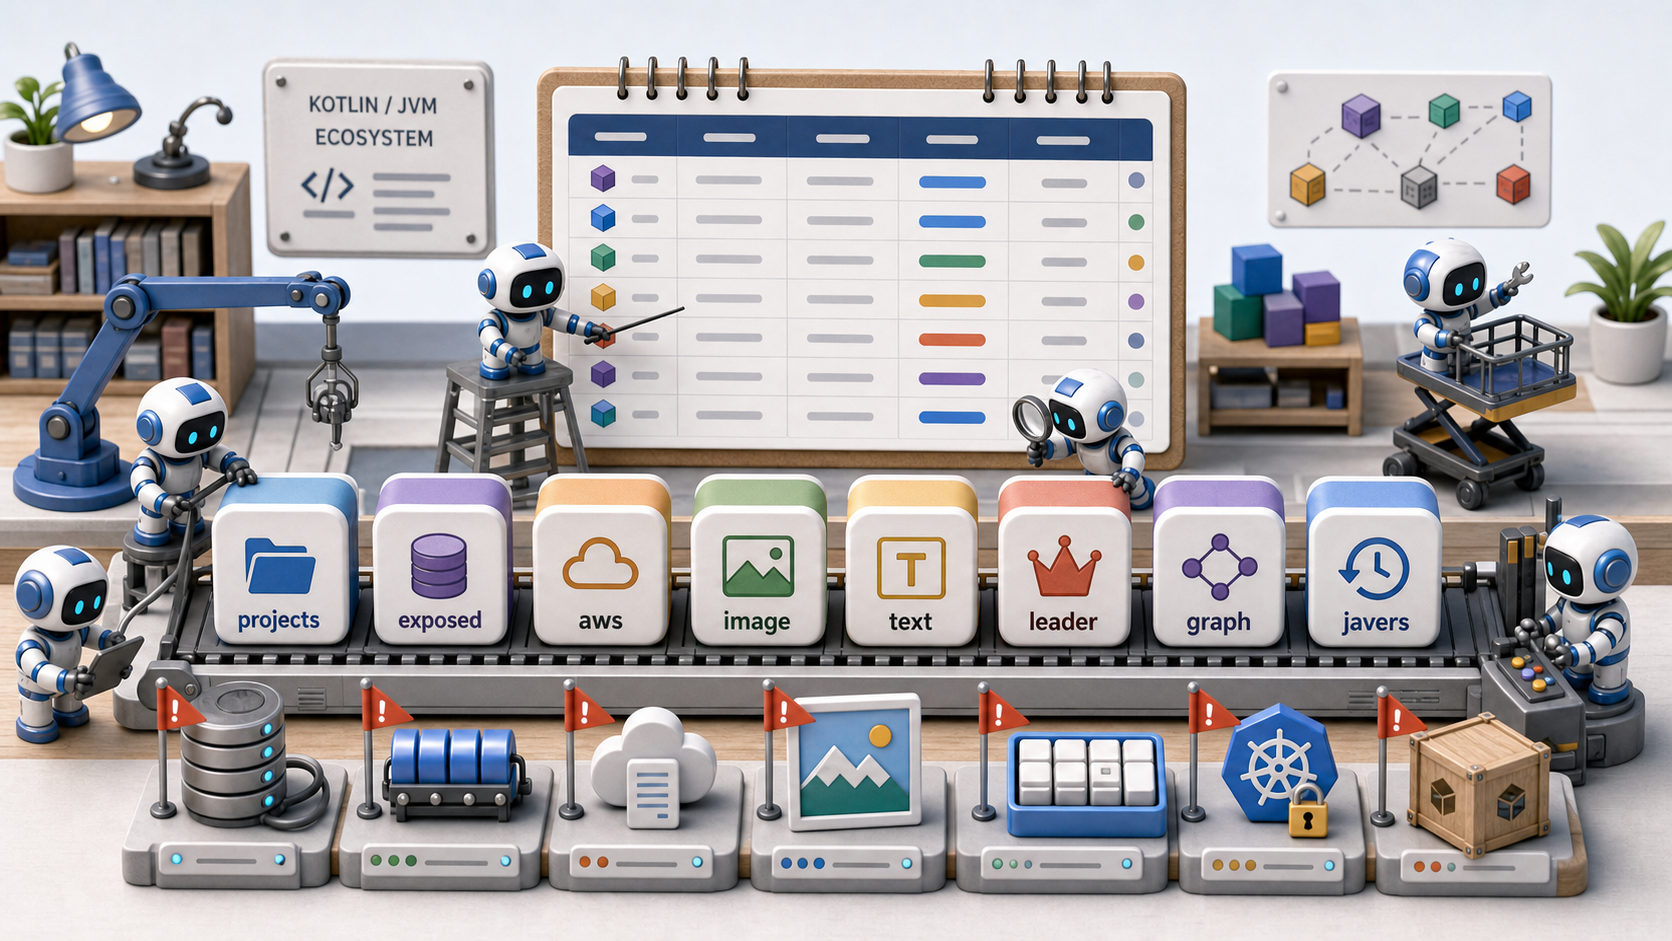
The hardest production issue is not always the one that fails immediately. A hard failure raises an alarm and gives the team a stack trace. The worse case is a system that keeps returning successful responses while a cache flush, metric name, or leader renewal is wrong underneath.
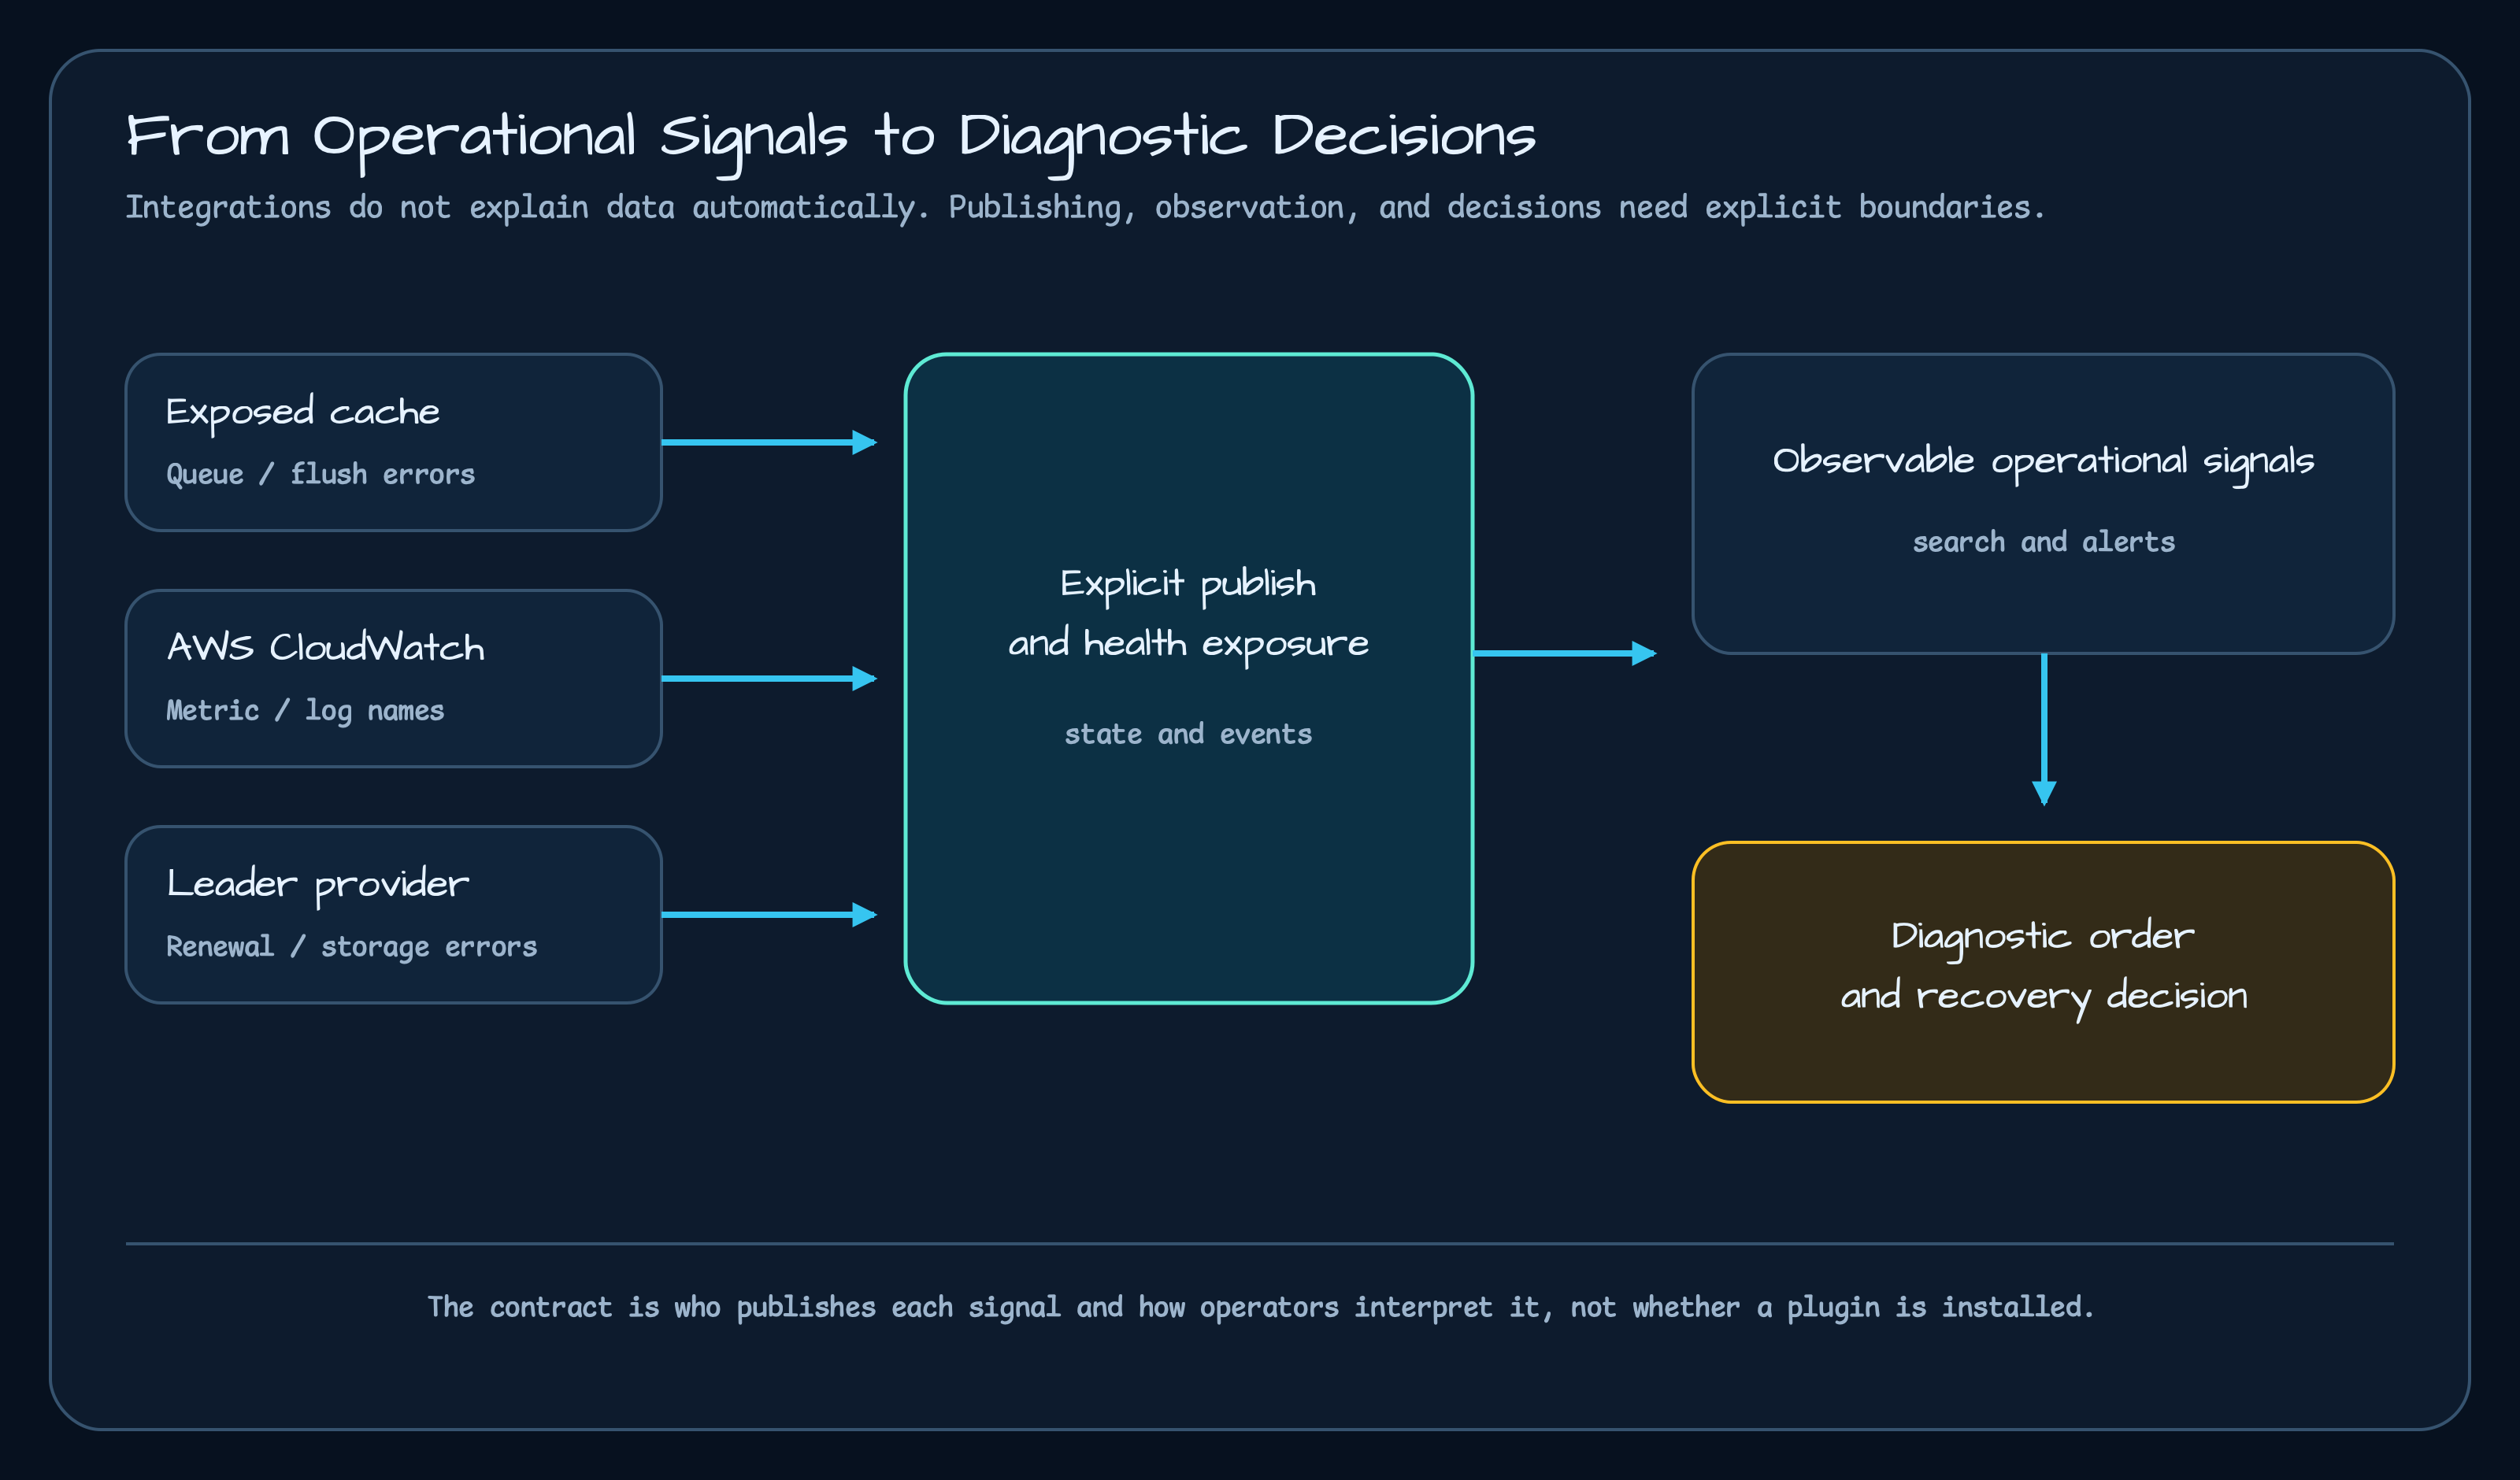
dependencies 1.3.0 improved several of those visibility boundaries:
exposed 1.11.0exposes cache state through health.aws 0.4.0clarifies CloudWatch metric and log boundaries in Ktor and Spring.leader 0.4.0makes provider/storage choices and metric checkpoints more explicit.
Exposed Cache: See Whether Flush Stopped
Section titled “Exposed Cache: See Whether Flush Stopped”A write-behind cache is useful because request handling does not wait on every backing write. The risk is the same property: the request can look successful while the background flush is stuck.
The following payload reflects the JDBC health indicator shipped in exposed 1.11.0.
{ "status": "OUT_OF_SERVICE", "components": { "exposedCache": { "status": "OUT_OF_SERVICE", "details": { "reports": [ { "name": "invoice-cache", "mode": "WRITE_BEHIND", "queueDepth": 128, "flushJobRunning": false, "lastFlushError": "Redis connection failed" } ] } } }}The important fields are operational, not decorative.
| Value | Why it matters |
|---|---|
mode | A write-through and write-behind failure mean different things. |
queueDepth | Shows whether flush work is backing up. |
flushJobRunning | Shows whether the background flush loop is alive. |
lastFlushError | Hints whether the problem is closer to DB, Redis, or serialization. |
Without this, an operator sees only a slow service or inconsistent reads. With it, /actuator/health can show that the
cache layer itself is no longer healthy.
AWS CloudWatch/Logs: Name Things Before You Need Them
Section titled “AWS CloudWatch/Logs: Name Things Before You Need Them”Metric and log plumbing is easy to treat as a side effect. That becomes painful when the service has several environments and instances.
install(CloudWatchKtorPlugin) {    namespace = "bluetape4k/billing"}
install(CloudWatchLogsKtorPlugin) {    logGroupName = "/bluetape4k/billing-api"    logStreamName = instanceId    flushInterval = Duration.ofSeconds(5)    shutdownFlushTimeout = Duration.ofSeconds(5)}
Metric dimensions belong to each published MetricDatum, not to plugin installation. Installing either plugin also
does not publish data automatically: the application must explicitly publish metrics or append buffered log events.
observability: cloudwatch: namespace: bluetape4k/billing dimensions: service: billing environment: prod cloudwatch-logs: group: /bluetape4k/billing-api stream: ${instanceId}This YAML is an application-owned naming policy, not a library auto-configuration contract. If the namespace, dimensions, group, and stream are not chosen deliberately, production search becomes guesswork.
Leader: Provider Choice Brings Storage and Runtime
Section titled “Leader: Provider Choice Brings Storage and Runtime”Leader election is not just a boolean feature. Choosing a provider also chooses the storage, client runtime, failure mode, and metric surface.
Need one scheduled worker? -> choose provider/storage -> verify runtime classpath -> watch renewal, latency, and storage errors| Provider/storage | First signal to watch | What to inspect on failure |
|---|---|---|
| Redis | lock renewal latency, Redis connection errors | Redis failover, network partition, TTL settings |
| SQL/Exposed | lock row update latency, transaction errors | DB lock waits, isolation, connection pool |
| Kubernetes Lease | lease renewal failures, API server latency | service account permissions, Fabric8/runtime line |
| DynamoDB | conditional write failures, throttling | IAM, capacity, region, table key design |
leader 0.4.0 also fixed a Kubernetes K3s test runtime conflict. That kind of fix is a reminder that backend choice
can bring a sensitive runtime line. It is worth checking what is actually on the classpath.
./gradlew dependencyInsight --dependency fabric8 --configuration runtimeClasspath./gradlew dependencyInsight --dependency kubernetes --configuration runtimeClasspathProduction Checklist
Section titled “Production Checklist”| Area | Question |
|---|---|
| Exposed cache | Can /actuator/health show cache mode, queue depth, and flush state? |
| AWS metrics | Are namespace and dimension names aligned to service and environment? |
| AWS logs | Can the service and instance be found from log group and stream names alone? |
| Leader | Are metrics and failure signals separated by provider/storage? |
| Runtime classpath | Did you inspect sensitive runtime lines such as Kubernetes, Ktor, and AWS SDK? |
Closing
Section titled “Closing”dependencies 1.3.0 is not only a version table. It carries several production-facing boundaries: cache health,
CloudWatch/Logs naming, leader backend selection, and runtime classpath checks. Those are the places that decide whether
an incident is visible early or discovered after users notice the symptoms.
Series
Section titled “Series”If you want the first import path, start with the usage guide.
- bluetape4k-dependencies 1.3.0 in Practice Part 1: Features and Cleanup
- bluetape4k-dependencies 1.3.0 in Practice Part 2: Selecting Modules by Service Boundary
- bluetape4k-dependencies 1.3.0 in Practice Part 3: Production Signals
- bluetape4k-dependencies 1.3.0 in Practice Part 4: Input Boundaries
Comments
Leave a note or reaction with your GitHub account.