
Rebuilding Batch Benchmarks: Moving from measureTimeMillis to kotlinx-benchmark

Batch code eventually makes you ask for performance numbers. Wrapping a block in measureTimeMillis
gets a number quickly. That part is easy. The next question is harder.
Can we trust this number enough to change code?
The early bluetape4k-batch benchmarks lived close to tests and used ad hoc timing. For small checks,
that felt good enough. Once the comparison expanded to JDBC/R2DBC, H2/PostgreSQL/MySQL, pool size, and
partition count, the method started to creak. Numbers still appeared, but explaining the exact
conditions behind them became harder. That is dangerous in performance work. A confident-looking number
can still send you into cleanup work later.
This post explains why the utils/batch benchmark in bluetape4k-exposed moved to
kotlinx-benchmark and how the benchmark is structured today. The implementation now lives in
bluetape4k-exposed/utils/batch;
the older planning documents were written before the module moved out of bluetape4k-projects.
What Was Wrong With the Old Shape?
Section titled “What Was Wrong With the Old Shape?”measureTimeMillis is not a bad tool. It is fine for quick checks. It is not enough when the result will
guide README claims, benchmark charts, or implementation choices.
| Problem | Why it hurts |
|---|---|
| No warmup | JVM/JIT startup behavior can leak into the result |
| Weak repetition and statistics | It is hard to tell whether a number is stable |
| Tests and benchmarks are mixed | Test failure and benchmark failure mean different things |
| Documentation drifts | A rerun can leave README values behind |
| Small input sizes | A 100-row case rarely exposes batch bottlenecks |
The first mistake was assuming one timed test run could pick a winner. Batch workloads change shape with data size, connection pool size, and partition count. A path that wins under one condition may not win under another.
So the benchmark moved into its own source set.
utils/batch/├── build.gradle.kts├── benchmark/│ ├── README.md│ ├── h2.md│ ├── postgresql.md│ └── mysql.md└── src/ ├── main/kotlin/ ├── test/kotlin/ └── benchmark/kotlin/io/bluetape4k/batch/benchmark/ ├── jdbc/ ├── r2dbc/ └── support/Tests verify behavior. Benchmarks fix measurement conditions. Keeping those concerns separate makes the numbers easier to interpret later.
A Dedicated Benchmark Source Set
Section titled “A Dedicated Benchmark Source Set”utils/batch/build.gradle.kts defines a separate benchmark source set. Since kotlinx-benchmark runs
on JMH for JVM targets, benchmark state classes also need to be open.
plugins {    kotlin("plugin.allopen")    alias(libs.plugins.kotlinx.benchmark)}
allOpen {    annotation("org.openjdk.jmh.annotations.State")}
sourceSets {    create("benchmark")}
kotlin {    target {        compilations.getByName("benchmark")            .associateWith(compilations.getByName("main"))    }}
That allOpen block matters. Kotlin classes are final by default; JMH does not adapt itself to that
detail. Missing this configuration is the kind of mistake that sends you back to Gradle after staring at
the benchmark class for too long.
The benchmark profiles are split by database and driver.
benchmark { targets { register("benchmark") { this as kotlinx.benchmark.gradle.JvmBenchmarkTarget jmhVersion = libs.versions.jmh.get() } } configurations { register("postgresJdbc") { include("io.bluetape4k.batch.benchmark.jdbc.PostgreSqlJdbcBatchBenchmark") warmups = 2 iterations = 5 iterationTime = 1 iterationTimeUnit = "s" mode = "thrpt" outputTimeUnit = "s" reportFormat = "json" } register("postgresR2dbc") { include("io.bluetape4k.batch.benchmark.r2dbc.PostgreSqlR2dbcBatchBenchmark") warmups = 2 iterations = 5 iterationTime = 1 iterationTimeUnit = "s" mode = "thrpt" outputTimeUnit = "s" reportFormat = "json" } }}The entrypoints are explicit.
./gradlew :bluetape4k-exposed-batch:postgresJdbcBenchmark./gradlew :bluetape4k-exposed-batch:postgresR2dbcBenchmark./gradlew :bluetape4k-exposed-batch:generateBenchmarkDocsThe benchmark mode is thrpt, reported as ops/sec; higher is better. The generated docs also include
avg ms; lower is better. A benchmark post should always state the metric direction. Otherwise readers
have to pause at every table.
kotlinx-benchmark is not limited to elapsed time. On JVM it runs on top of JMH, so the generated
benchmark JAR can be run with JMH profilers. For example, -prof gc adds allocation rate, allocation per
operation, GC count, and GC time signals such as gc.alloc.rate, gc.alloc.rate.norm, gc.count, and
when applicable, gc.time.
java -jar utils/batch/build/benchmarks/benchmark/jars/<benchmark-jar>.jar \ '.*PostgreSqlJdbcBatchBenchmark.*' \ -prof gcThe current utils/batch/benchmark/*.md tables and charts are still centered on thrpt and avg ms.
Documenting GC profiler output would require another pass over the benchmark execution and markdown
exporter. That is the next level of evidence when the question moves from “which path is faster?” to
“why is this path slower?” In batch code, row mapping and chunk processing can create enough objects for
GC metrics to warn before the throughput number tells the whole story.
bluetape4k-image already has a useful reference point. Its large image streaming benchmark handles a
load-transform-write pipeline, which is close to batch work in the sense that large inputs move through
several processing stages. That report measures primary latency with kotlinx-benchmark, then records a
separate JMH GC profiler addendum with gc.alloc.rate.norm. In that run, the Scrimage ByteArray path
allocated about 216 MiB/op for large-photo, while the vips Path path stayed around 0.54 MiB/op. That is
the kind of signal an average-time table alone can hide.
Keep the Variables in @Param
Section titled “Keep the Variables in @Param”The comparison axes are fixed first. Database and driver belong to benchmark classes/profiles; scenario
variables are held in @Param.
@State(Scope.Benchmark)open class SeedScenarioParams {    @Param("1000", "10000", "100000")    var dataSize: Int = 1000
    @Param("10", "30", "60")    var poolSize: Int = 10}
@State(Scope.Benchmark)open class JobScenarioParams {    @Param("1000", "10000", "100000")    var dataSize: Int = 1000
    @Param("10", "30", "60")    var poolSize: Int = 10
    @Param("1", "4", "8")    var parallelism: Int = 1}
Here parallelism means partition count, not thread count. That distinction has to be documented.
Otherwise it is easy to read the result as if the benchmark simply raised worker threads to 8. In this
benchmark, the source key range is split into partitions and each partition is handled as a separate
batch job.
The matrix is not tiny.
| Scenario | Combinations |
|---|---|
| Seed | 3 DBs x 2 drivers x 3 data sizes x 3 pool sizes = 54 |
| End-to-End | 3 DBs x 2 drivers x 3 data sizes x 3 pool sizes x 3 partition counts = 162 |
Once the matrix is this large, “I timed it once” is not enough. By the time you notice that the number lied, you may have already spent a while cleaning up the wrong thing.
Separate Seed From End-to-End
Section titled “Separate Seed From End-to-End”seedBenchmark and endToEndBatchJobBenchmark measure different bottlenecks.
| Scenario | What is measured | What stays outside the measurement |
|---|---|---|
| Seed | Source-row INSERT throughput | Testcontainers startup, pool creation, schema creation |
| End-to-End | One batch job over already seeded source rows | Testcontainers startup, pool creation, schema creation, seed loading |
The JDBC benchmark infrastructure states the boundary directly.
/** * ## 측정 경계 * - 측정 외부: Testcontainers 기동, DataSource/커넥션 풀 생성, 스키마 생성 * - 시드 벤치마크 본문: 소스 행 INSERT만 측정 * - 엔드 투 엔드 벤치마크 본문: 소스 데이터 적재 완료 후 배치 잡 1회 실행만 측정 */Without this boundary, the benchmark becomes muddy fast. A slow first run might be container startup, schema creation, pool initialization, or the actual batch job. Those are different problems.
The JDBC end-to-end path partitions the source key range and runs one job per partition.
internal fun partitionRanges(db: Database, parallelism: Int): List<KeyRange> {    parallelism.requirePositiveNumber("parallelism")    val (minKey, maxKey) = minMaxKey(db)    val totalKeys = maxKey - minKey + 1    val partitionCount = minOf(parallelism.toLong(), totalKeys).toInt()    // ...}
internal fun runParallelJobs(db: Database, parallelism: Int): Int {    val ranges = partitionRanges(db, parallelism)    var totalWriteCount = 0    runSuspendIO {        coroutineScope {            ranges.mapIndexed { index, range ->                async {                    runJobPartition(                        db,                        "jdbcBenchmarkJob-partition-$index",                        range.minKeyExclusive,                        range.maxKeyInclusive,                    )                }            }.awaitAll().also { counts ->                totalWriteCount = counts.sum()            }        }    }    return totalWriteCount}
Both sequential and parallel paths use the same ExposedJdbcBatchJobRepository. If the repository
changed between paths, the benchmark would measure repository differences and parallelism at the same
time. Fewer variables make better benchmarks.
Treat Documentation as Part of the Benchmark
Section titled “Treat Documentation as Part of the Benchmark”The benchmark does not end at JSON. The generateBenchmarkDocs task reads JSON reports and refreshes
the Markdown benchmark docs under utils/batch/benchmark.
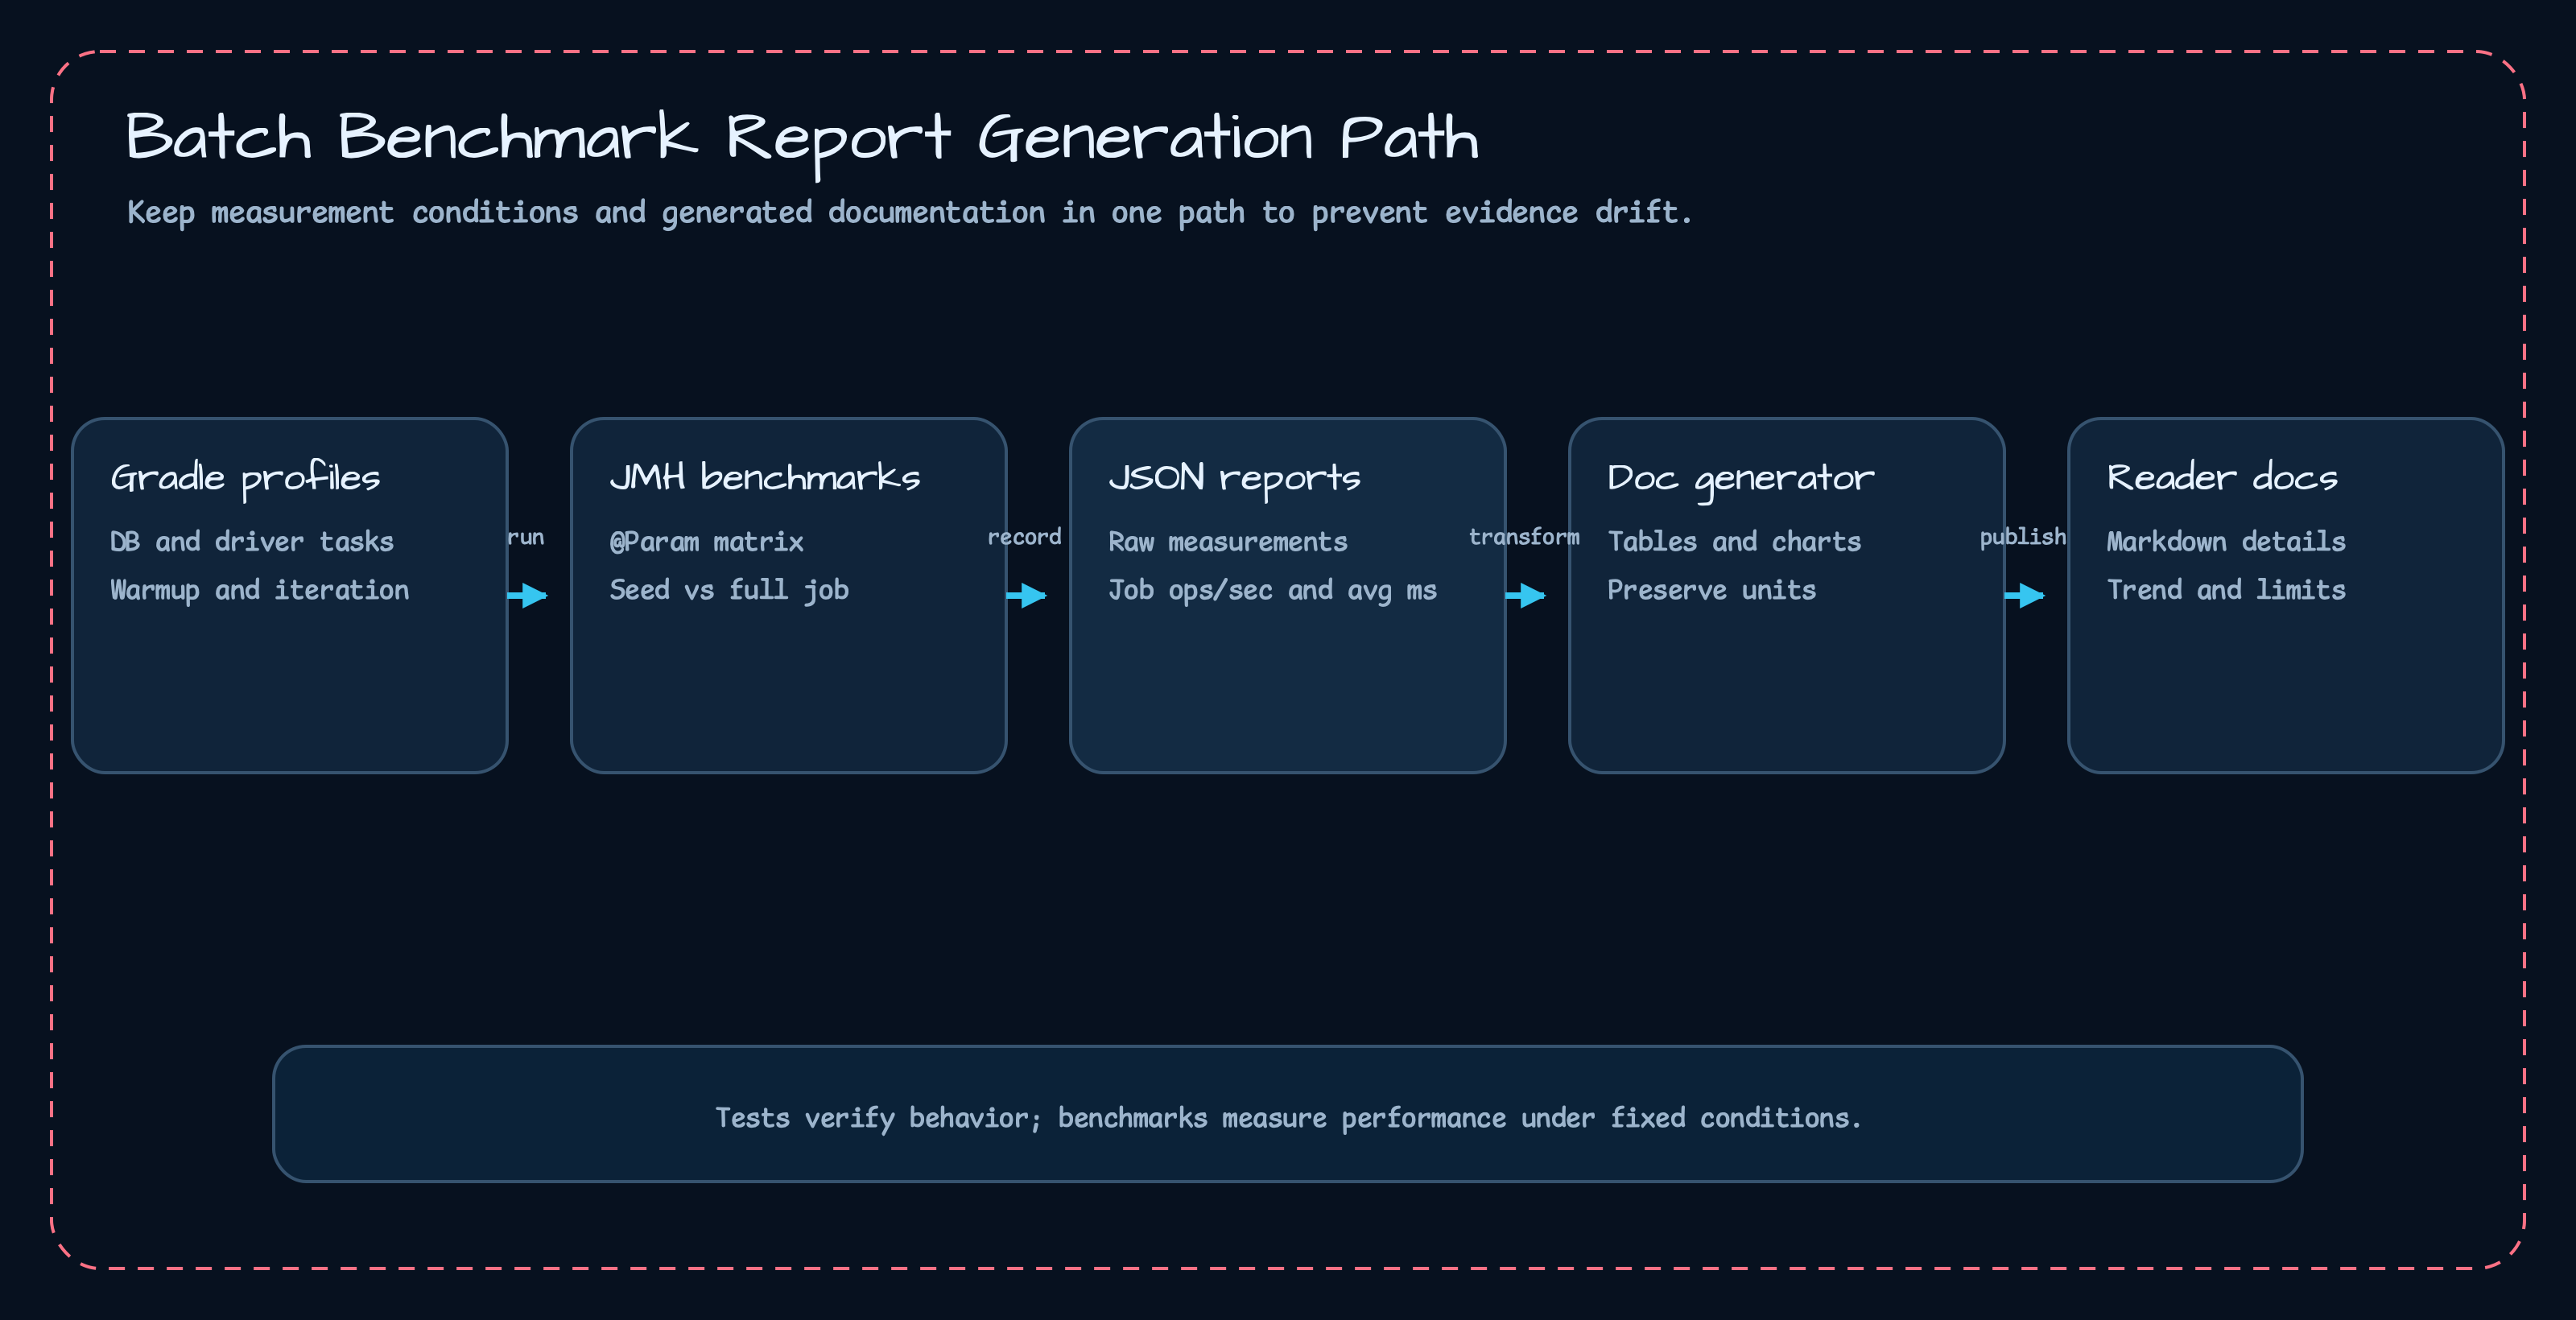
The goal is not to paste a CSV dump into a page. The docs first show the comparison axes, then expose the detailed rows.
| Doc element | What the reader gets |
|---|---|
| Profile table | The Gradle task and benchmark class to run |
| Comparison dimensions | The exact axes being compared |
| Result tables | ops/sec and avg ms for each combination |
| Charts | A fast view of the dominant trend |
| Notes | DB-specific interpretation cautions |
Manual number copying is how benchmark docs drift. Once the values drift, the document becomes an old record instead of evidence.
Reading the Representative Results
Section titled “Reading the Representative Results”The values below come from the currently generated utils/batch/benchmark/*.md files, which were built
from JSON benchmark reports. The full row set is larger, so this post uses representative large
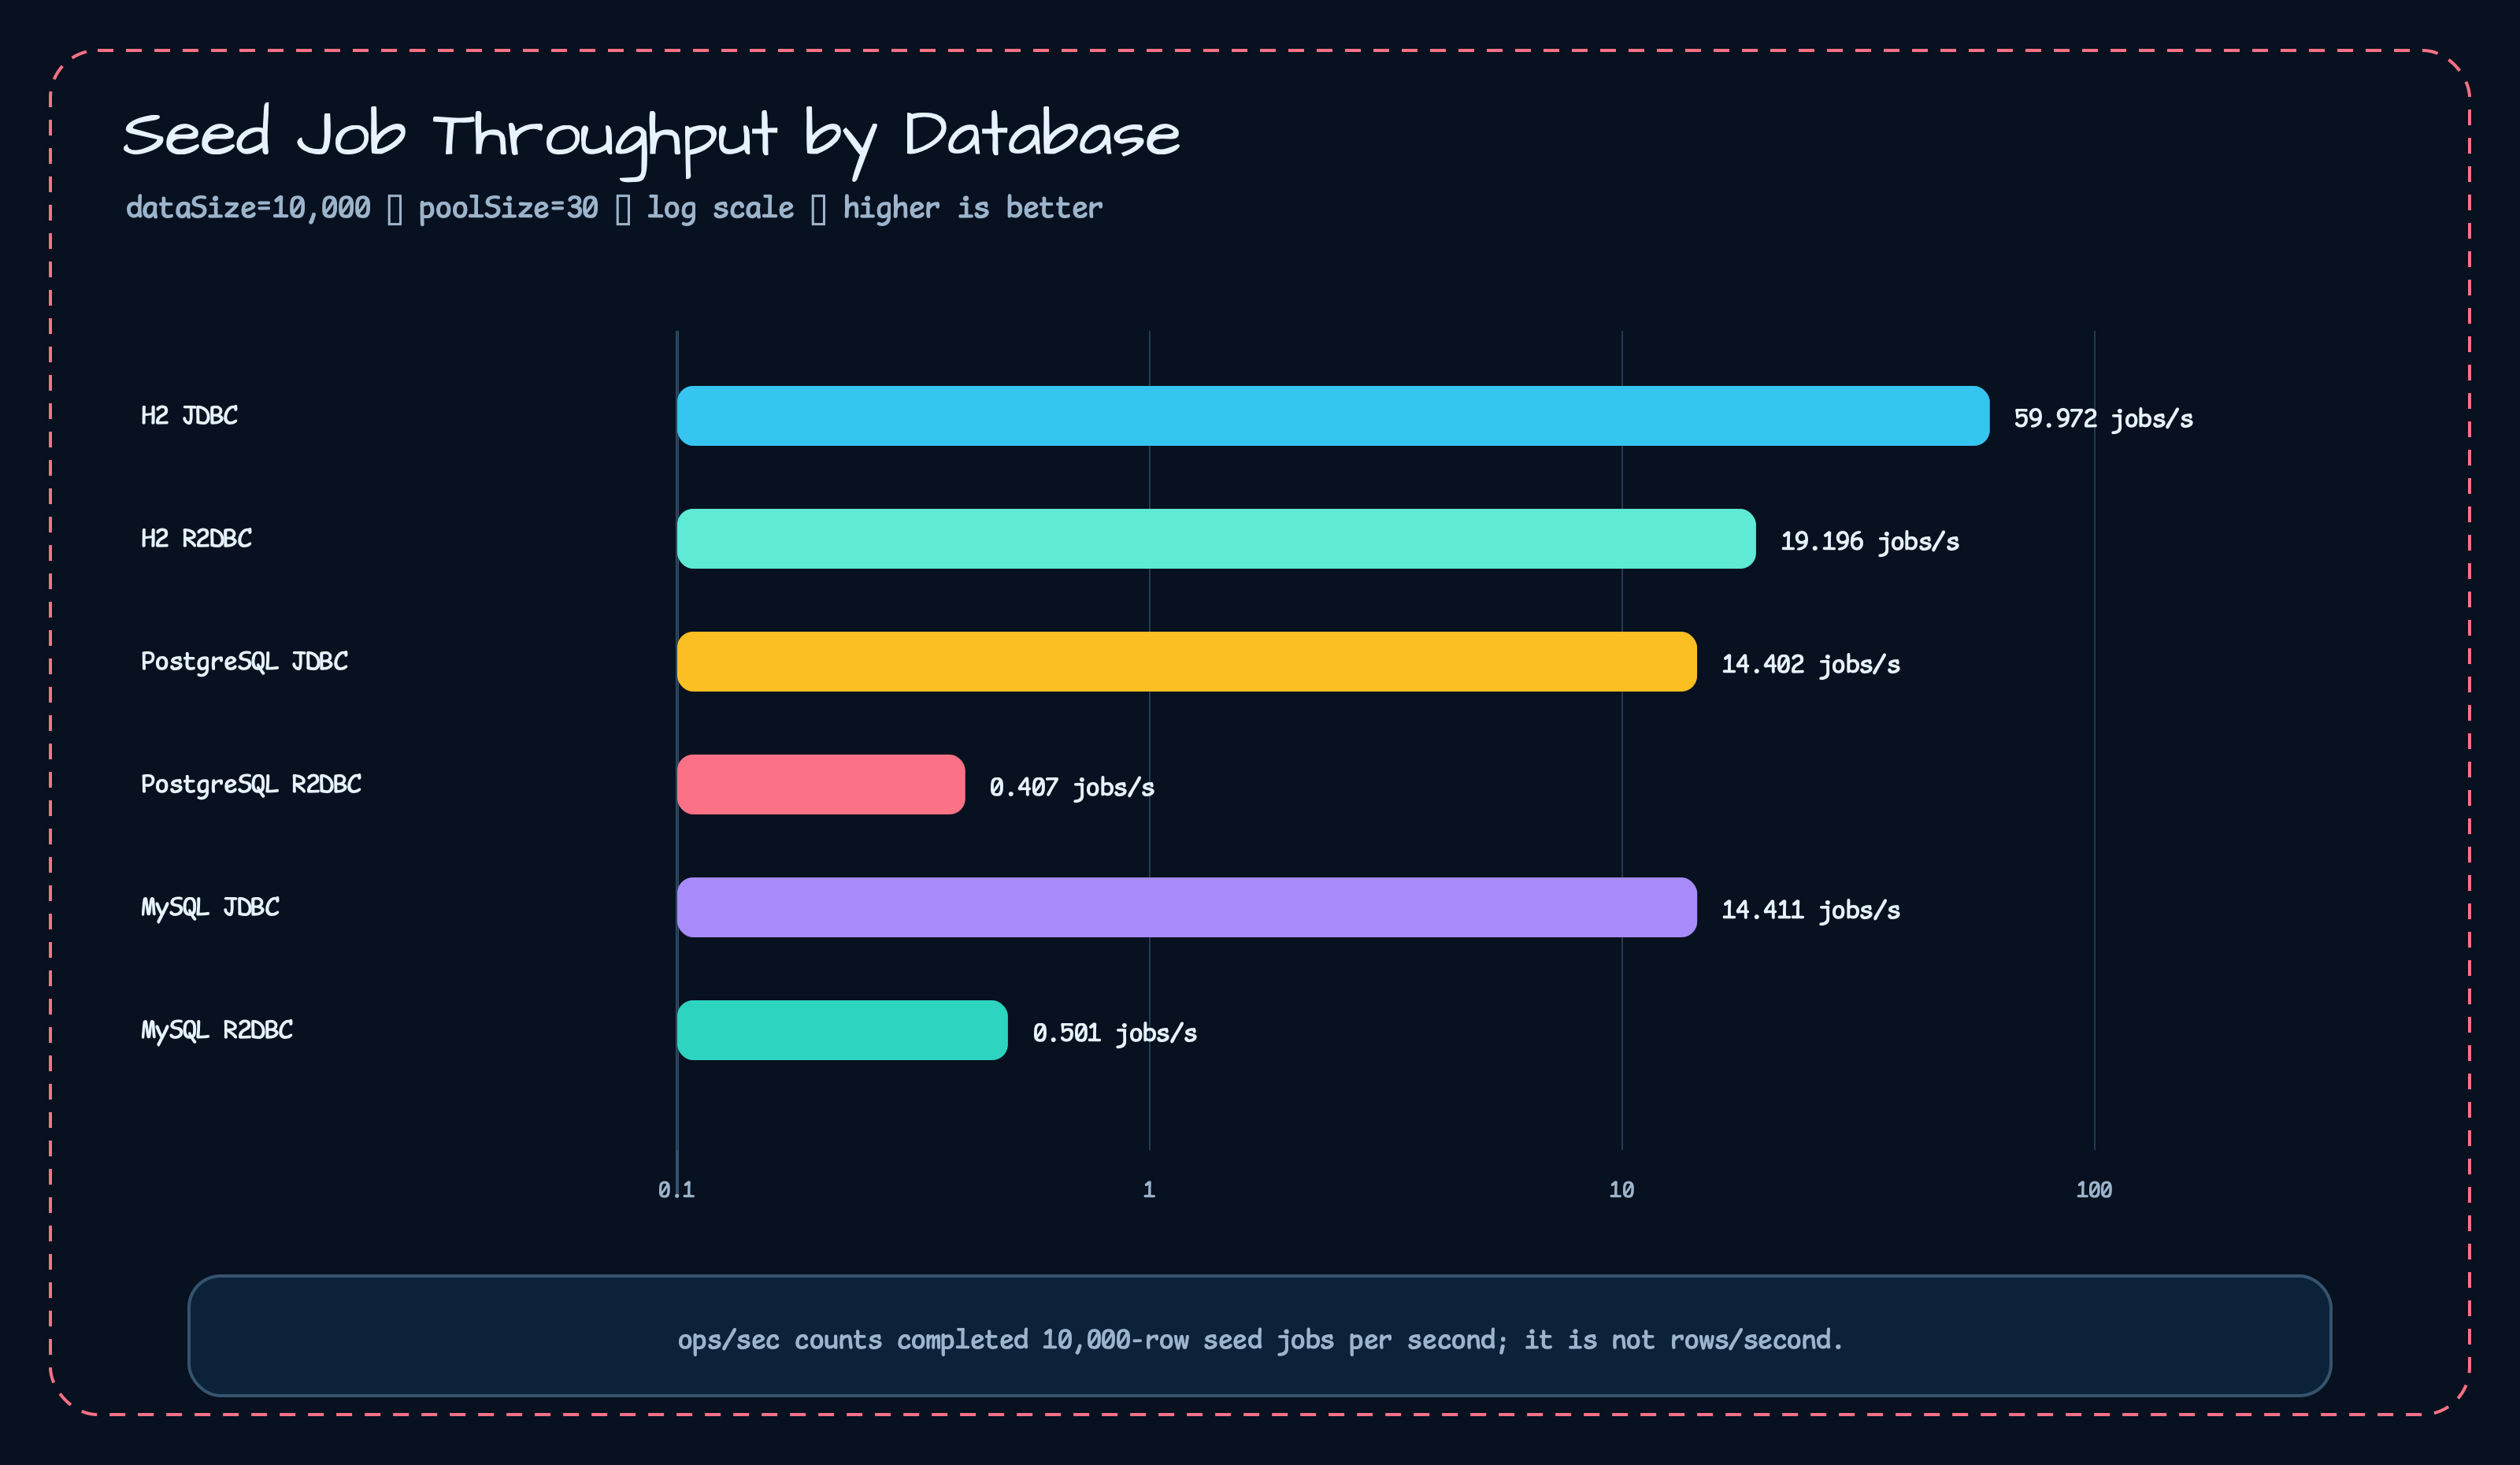
end-to-end profiles. Here, ops/sec counts completed batch-job invocations, not processed rows;
each invocation processes the configured dataSize. Higher ops/sec is better, while avg ms
is the mean duration of one full job and is lower-is-better.
| DB | Driver | dataSize | poolSize | parallelism | ops/sec | avg ms |
|---|---|---|---|---|---|---|
| PostgreSQL | JDBC | 100000 | 30 | 8 | 0.990 | 1010.557 |
| PostgreSQL | R2DBC | 100000 | 30 | 8 | 0.192 | 5201.966 |
| MySQL | JDBC | 100000 | 30 | 8 | 1.561 | 640.695 |
| MySQL | R2DBC | 100000 | 30 | 8 | 0.182 | 5505.989 |
JDBC is clearly ahead in those rows. The point of this post is not “JDBC always wins,” though. The more important point is that the result can explain its own conditions: workload, database, driver, pool size, partition count, metric, and documentation source.
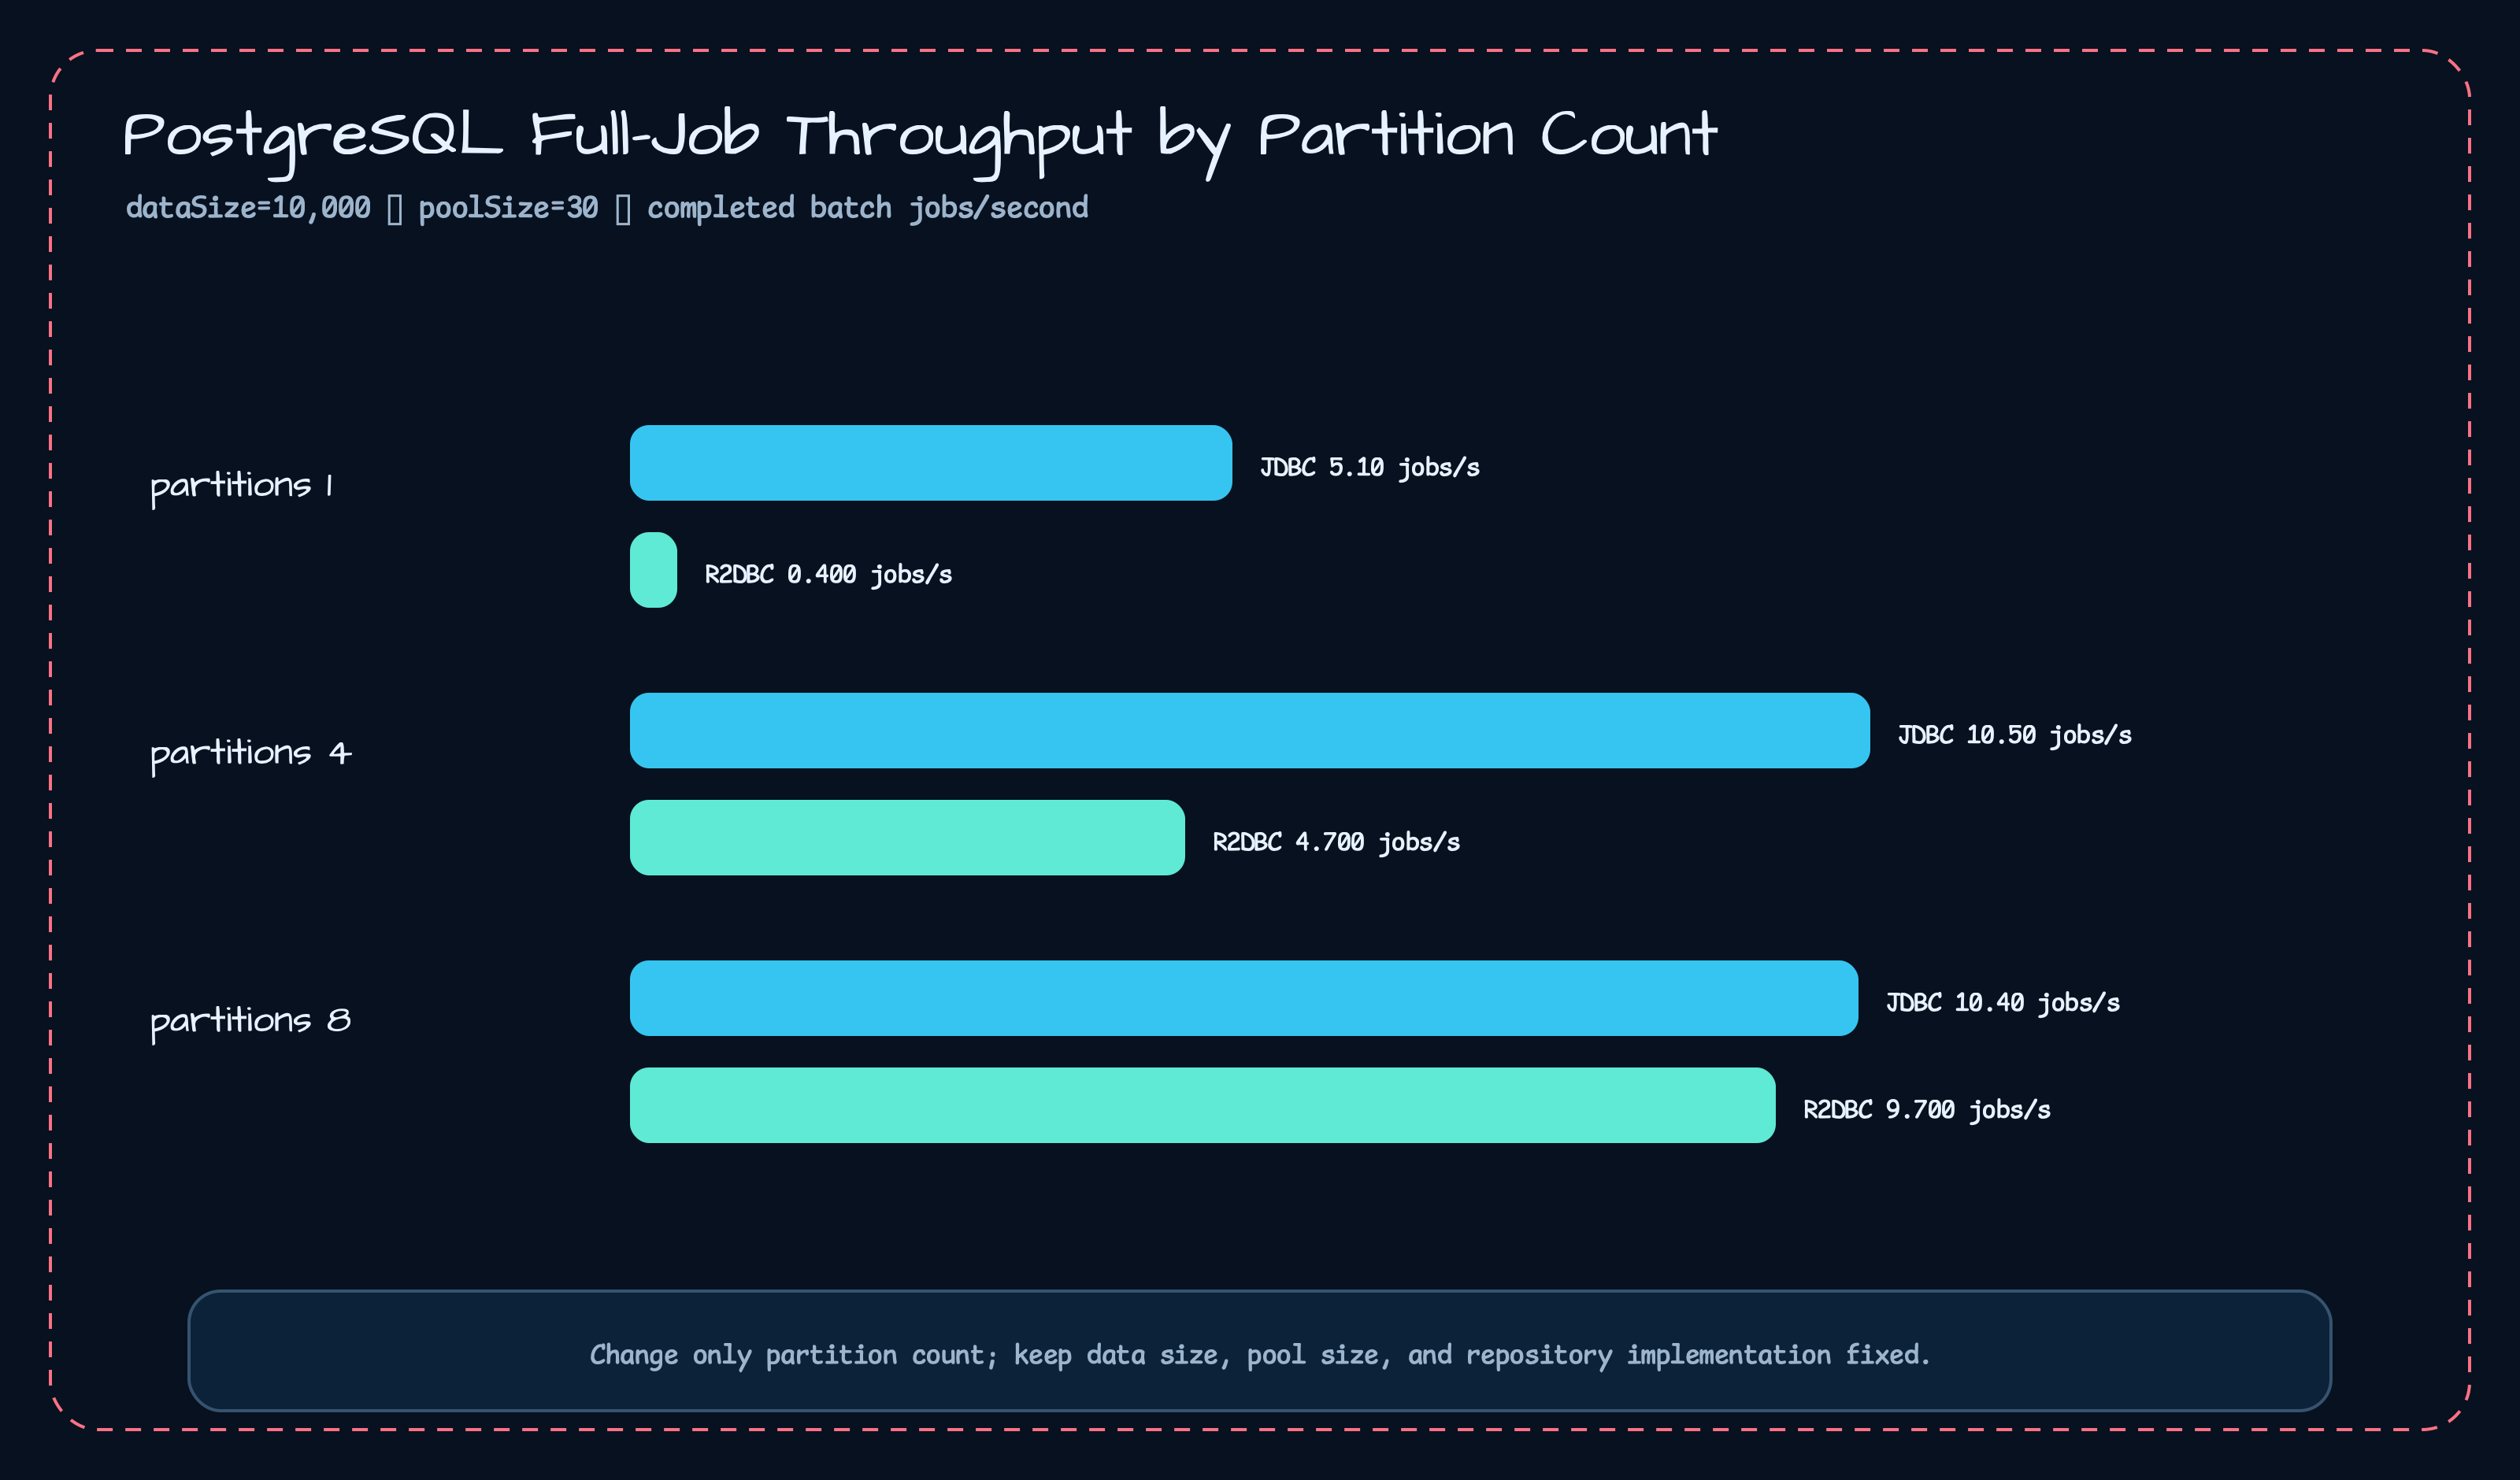
The PostgreSQL end-to-end chart makes the parallelism trend easier to scan for the
dataSize=10000, poolSize=30 profile.
When applying this to your own service, ask the same questions first: which workload, which database, which driver, which pool size, and which partition count?
What to Copy Into Your Own Benchmarks
Section titled “What to Copy Into Your Own Benchmarks”The reusable part is the structure, not the raw numbers.
| Pattern | Why it helps |
|---|---|
Separate src/benchmark/kotlin | Tests and performance measurement have different jobs |
| Split DB/driver profiles | Execution units match interpretation units |
Put scenario axes in @Param | Repeated measurements use the same matrix |
| Generate docs from JSON reports | Documentation stays tied to reruns |
Do not copy the benchmark values as forecasts for another service. Schema, network, driver version, JVM options, pool settings, and transaction size can change the result. Copy the measurement method instead.
This is a practical starting order.
1. Split the workload.   - Are you measuring seed/insert throughput?   - Or an already-seeded batch job?
2. Decide what stays outside the measurement.   - Container startup   - Connection pool creation   - Schema creation   - Test data preparation
3. Fix scenario axes with @Param.   - dataSize   - poolSize   - parallelism or partition count
4. Build the documentation refresh path.   - JSON report   - Markdown table   - Summary chart
This will not prevent every bad benchmark. It does make the cleanup easier because you can find where the mistake entered the measurement.
Comments
Leave a note or reaction with your GitHub account.