
When Ktor CIO Made HTTP Benchmarks Weird

The io/http module in bluetape4k-projects puts Apache HC5, OkHttp3, Java HttpClient,
Vert.x WebClient, and Ktor CIO behind the same API. From the caller’s side, they look like one
HTTP abstraction. Under the hood, each client handles connection reuse, coroutine bridges,
virtual threads, server fixtures, and pool settings differently.
That makes “just pick the one you like” the most dangerous advice this module could give. If we do not know which client holds up under which workload, the abstraction becomes a random-choice button. The benchmark cleanup was more than a tuning task. It was a small campaign to measure first, explain the numbers, and leave behind selection rules.
The first run did not start cleanly. Ktor CIO produced numbers that looked wrong.
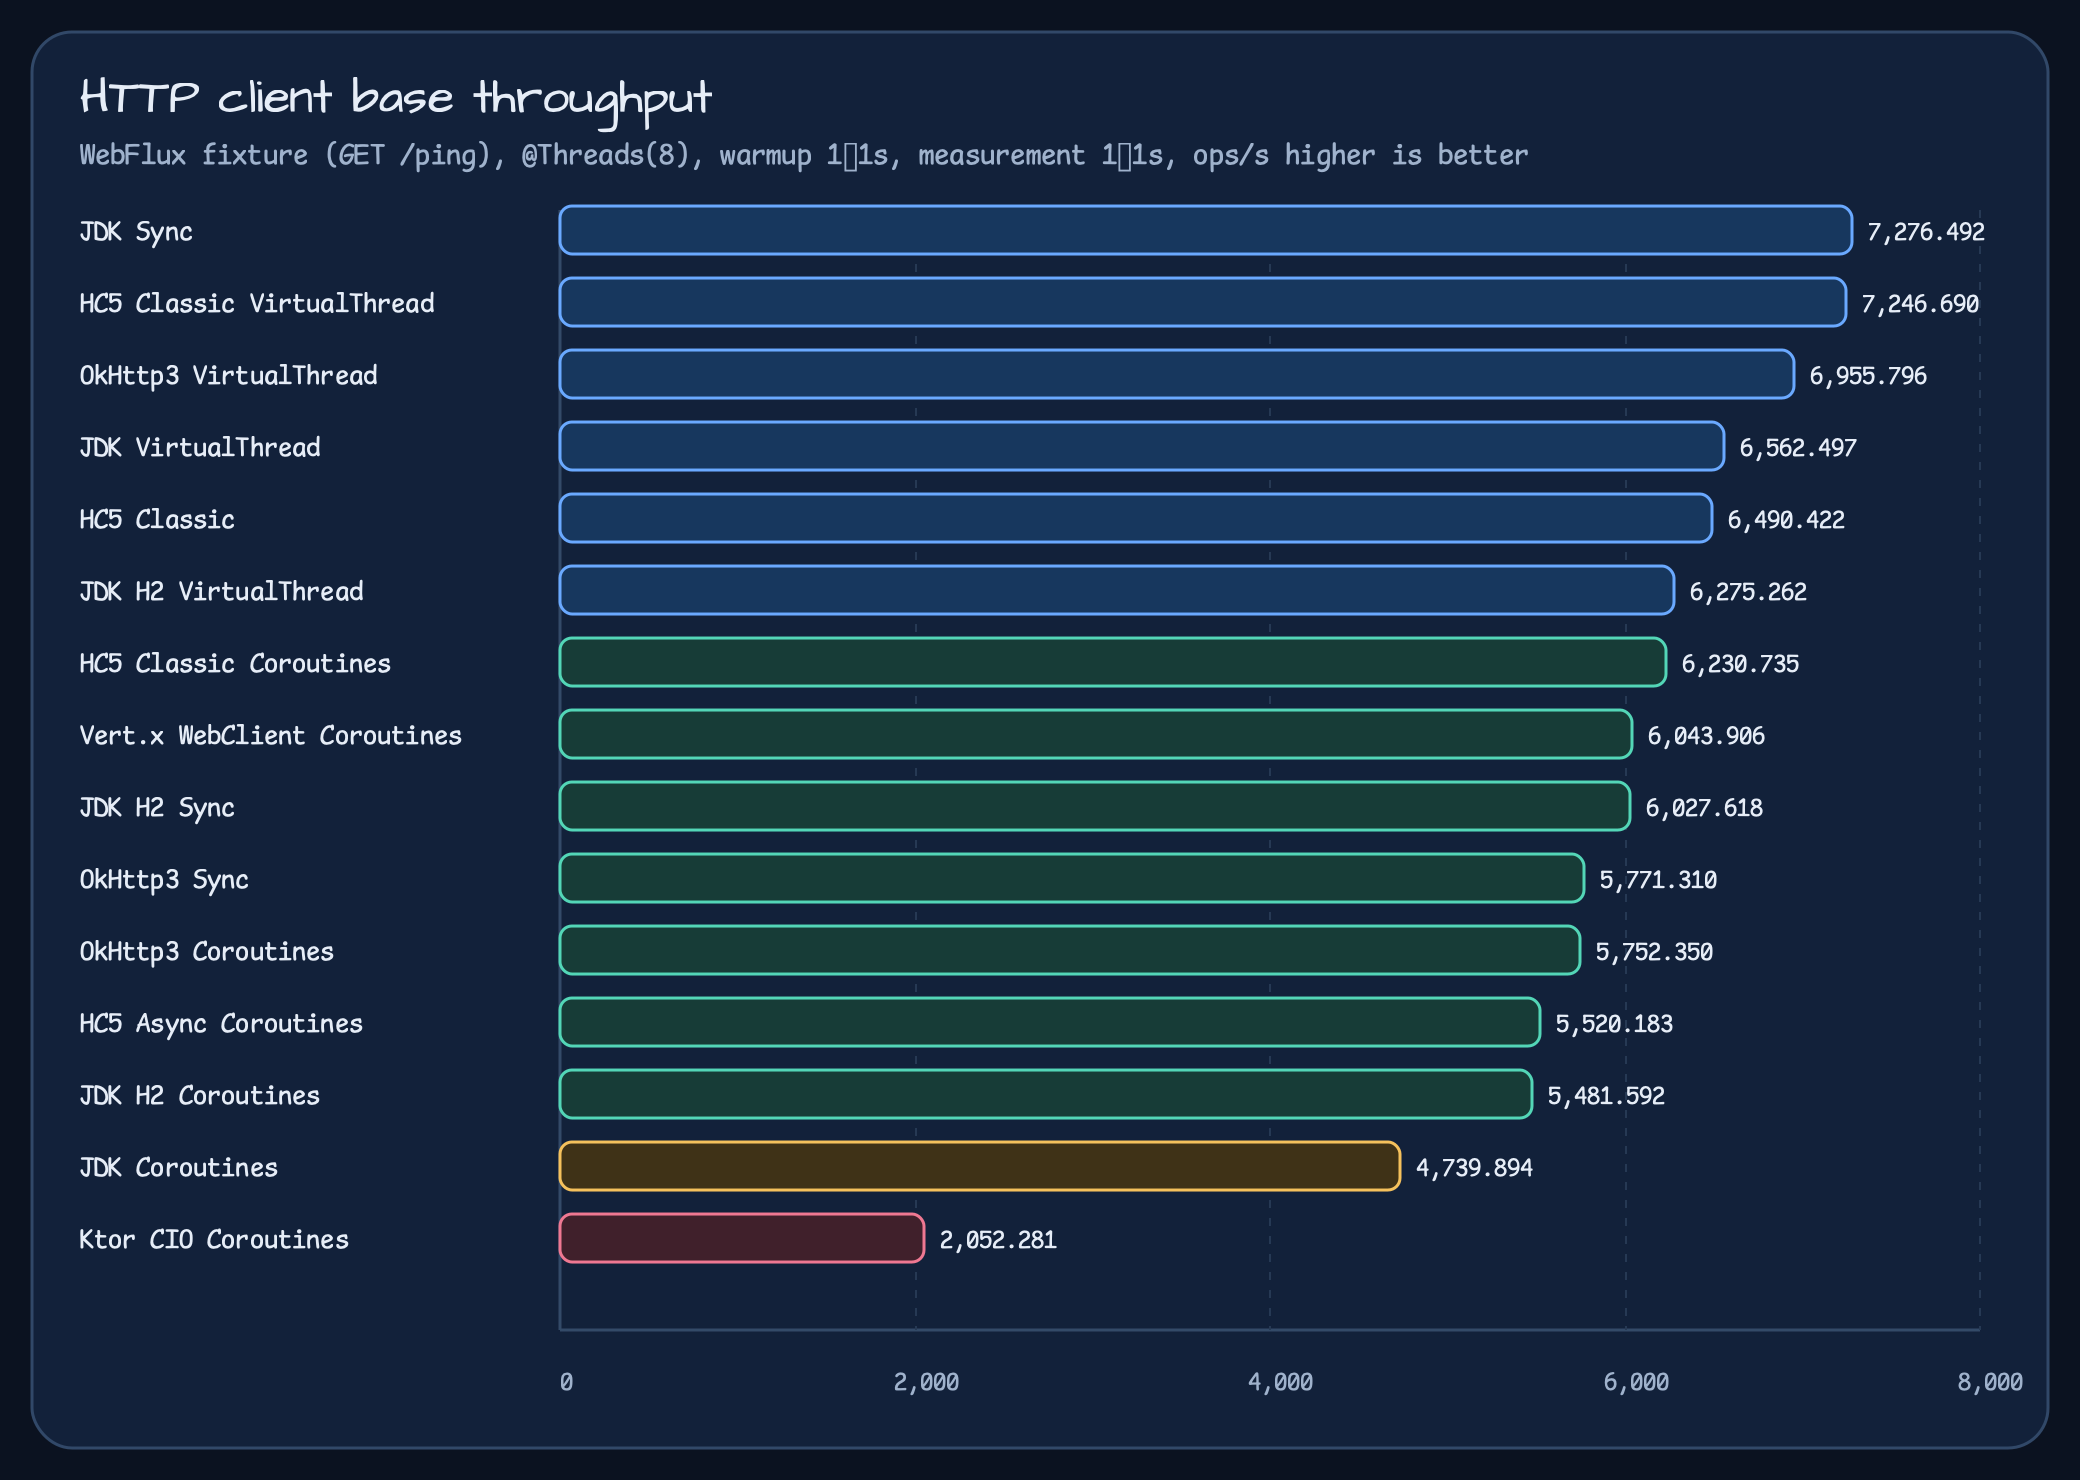
/ping throughput provides a baseline for comparing each client implementation’s upper range.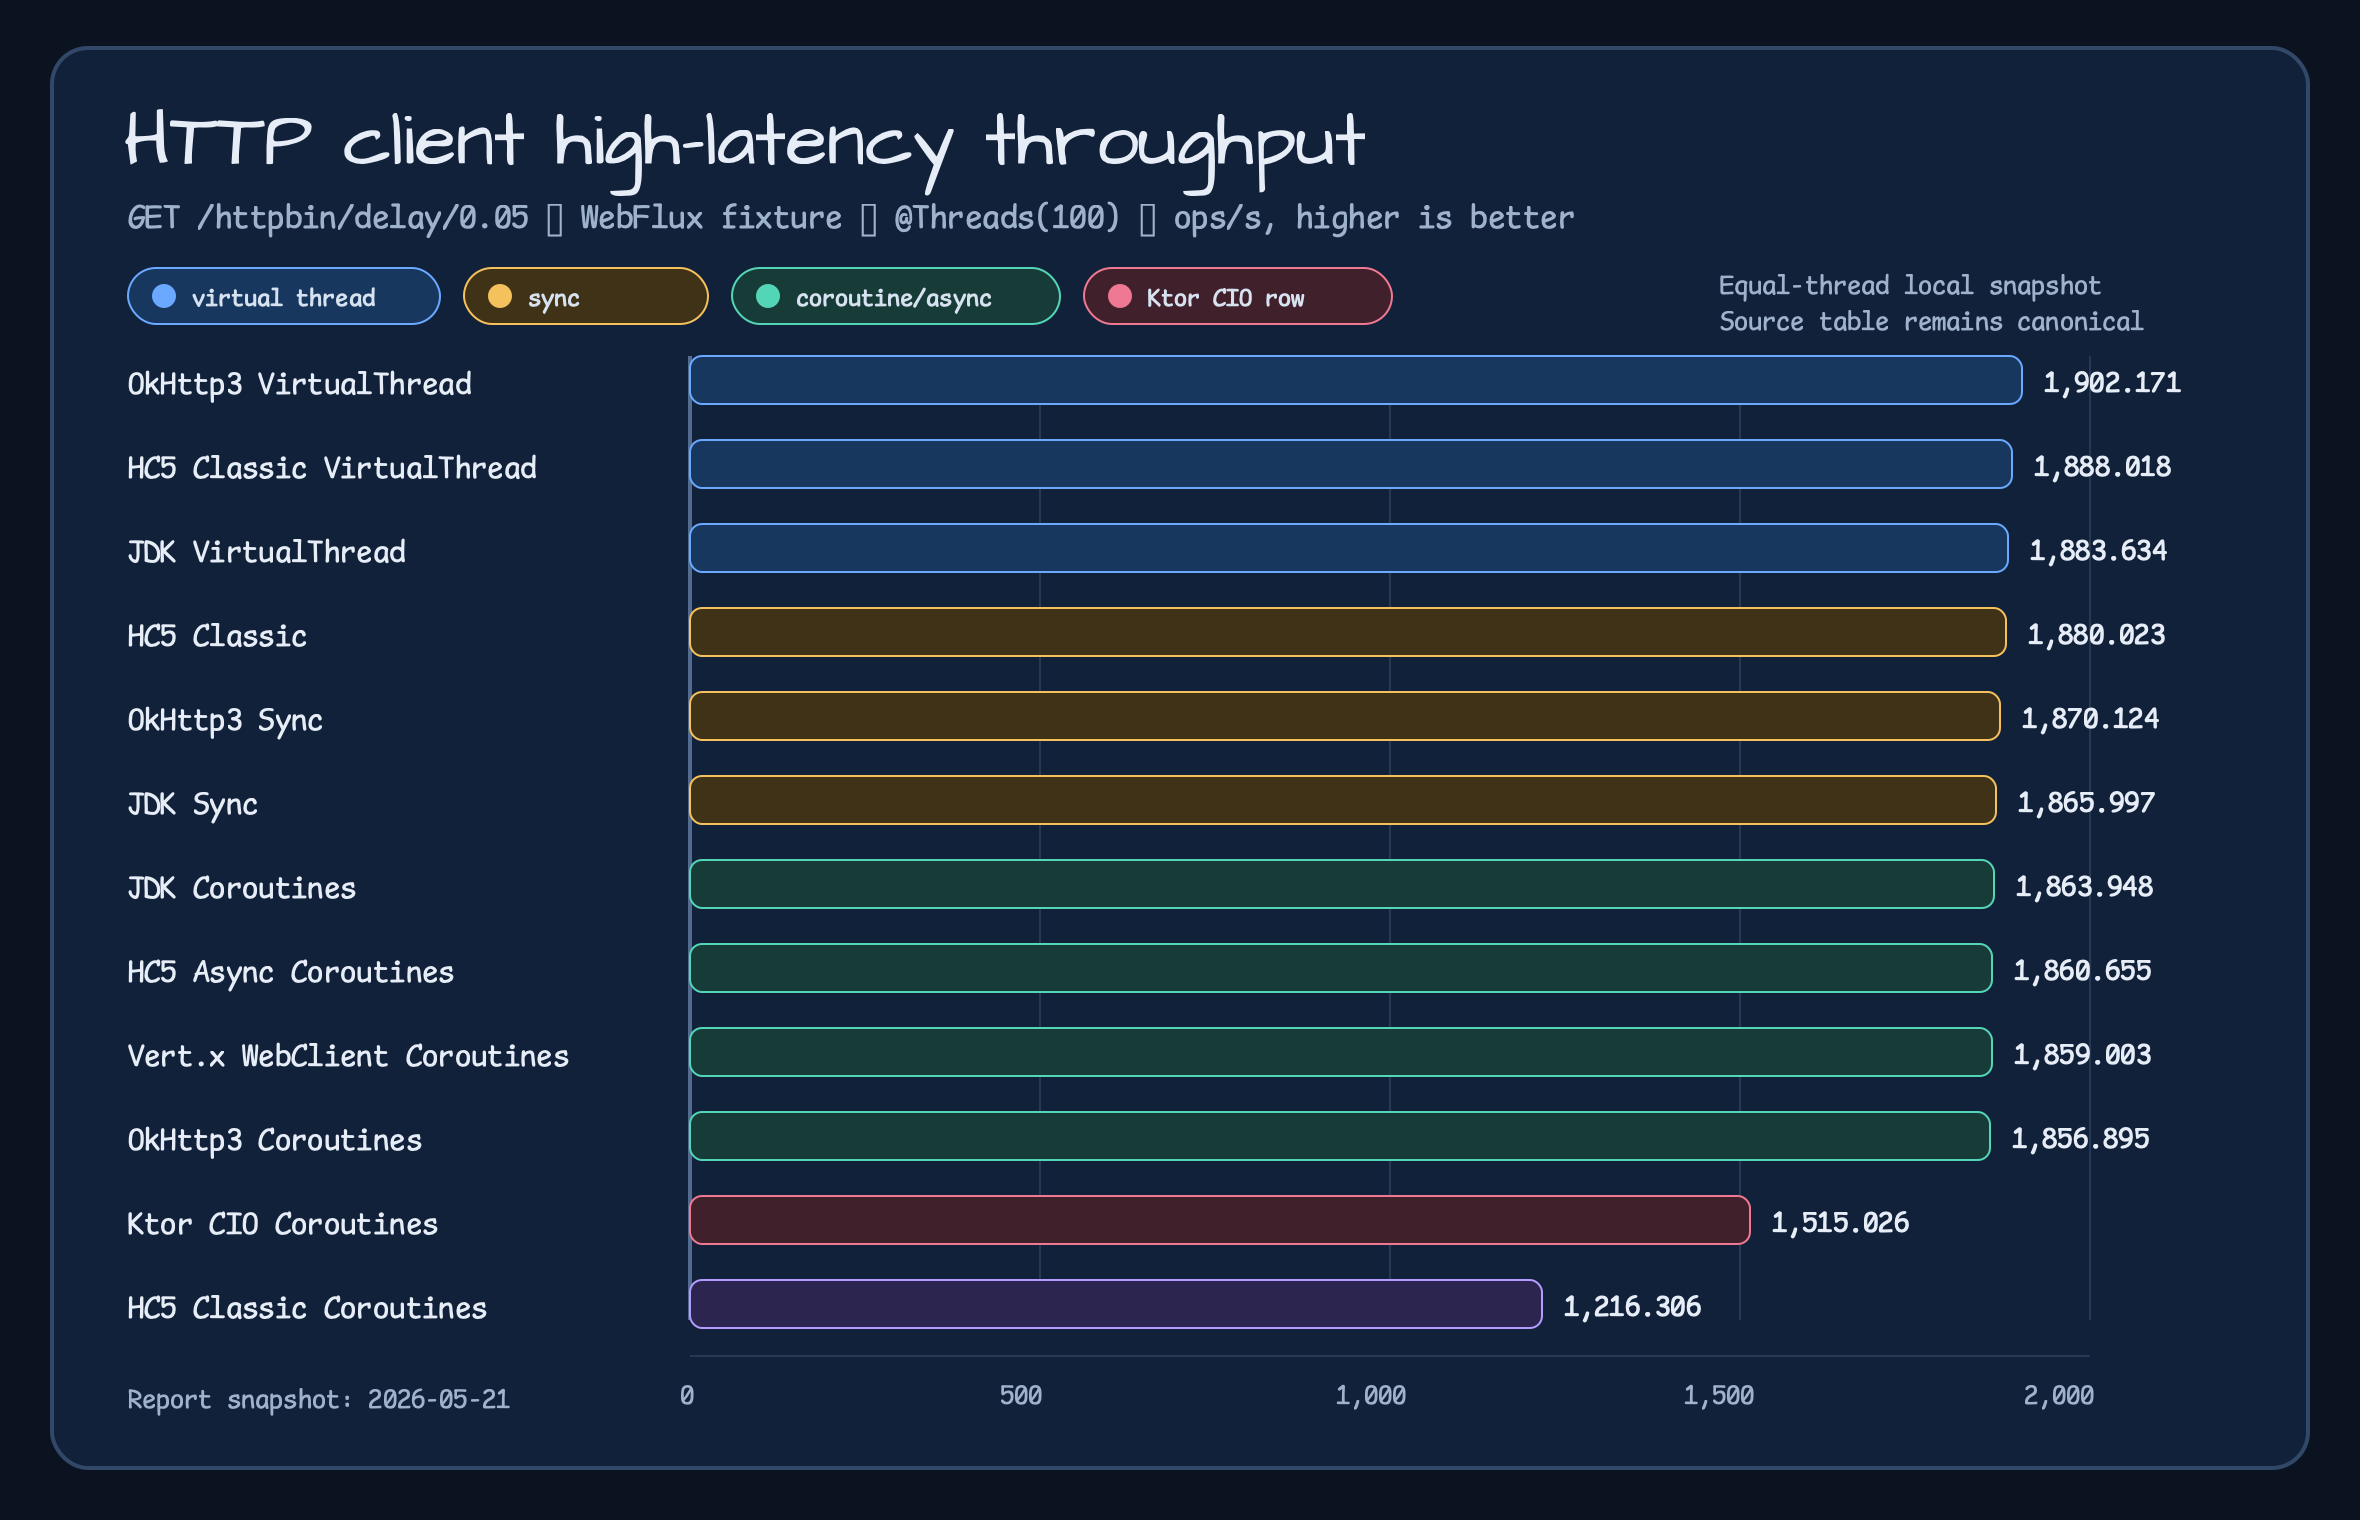
At First, CIO Was Painfully Slow
Section titled “At First, CIO Was Painfully Slow”The first Ktor CIO row made me want to close the table. It showed 659.071 ops/s on /ping and
16.501 ops/s on the 50 ms delay endpoint. Other clients were far ahead. Read literally, the row
said, “why did we include this?”
But that row was not a fair conclusion. With the full JMH concurrency, CIO exhausted local ephemeral ports in the Docker fixture before the benchmark could measure the client properly. The CIO row had been limited to one thread while other rows used the class-level thread count. It was in the same table, but it was not running under the same rules.
So the CIO follow-up was not about making CIO look fast. It was about measuring CIO under the same conditions. We kept the bad number, wrote down why it was bad, and fixed the fixture.
The First Win Was Vert.x
Section titled “The First Win Was Vert.x”The most dramatic change in the follow-up work was not Ktor. It was Vert.x.
The Vert.x WebClient benchmark was capped by the default HTTP/1 pool. It was not measuring what
the client could do. It was measuring a bottleneck created by the fixture and the default pool
settings. Once PoolOptions was explicit, high-latency throughput moved from 87.844 ops/s to
1,818.508 ops/s. That is about 20.7x.
That can be read as an optimization story. The more useful lesson is simpler.
Do not change production code just because a benchmark is slow. Suspect the measurement rig first.
Same Server, Same Concurrency
Section titled “Same Server, Same Concurrency”The next cleanup pass corrected the measuring conditions.
- The HTTP client benchmark fixture was moved to
BluetapeWebfluxServer. - The one-thread exception for CIO was removed.
- Every row used the class-level JMH thread count.
- To avoid local port exhaustion, the benchmark used short equal-thread snapshots: one second of warmup and one second of measurement.
I like this decision because it did not manufacture a “CIO won” conclusion. It exposed CIO’s
limits more clearly. Ktor CIO 3.5 opens HTTP/1 connections aggressively when pipelining is
disabled, and forcing pipelining=true in the local mock fixture caused
ClosedReadChannelException: unexpected EOF or hangs. So this post keeps the conclusion small.
It uses the default CIO behavior and compares a short same-concurrency snapshot.
Final Snapshot
Section titled “Final Snapshot”The base /ping benchmark is sensitive to connection reuse and local variance. It should not be
read as a production ranking. Treat it as a same-fixture snapshot.
| Client row | /ping ops/s |
|---|---|
Java HttpClient sync | 7,276.492 |
| HC5 classic virtual thread | 7,246.690 |
| OkHttp3 virtual thread | 6,955.796 |
| Vert.x WebClient coroutines | 6,043.906 |
| Ktor CIO coroutines | 2,052.281 |
The high-latency endpoint is more interesting. With a 50 ms delay, the benchmark starts to look less like a CPU loop and more like service wait time.
| Client row | 50 ms delay ops/s |
|---|---|
| OkHttp3 virtual thread | 1,902.171 |
| HC5 classic virtual thread | 1,888.018 |
Java HttpClient virtual thread | 1,883.634 |
| HC5 classic | 1,880.023 |
| HC5 async coroutines | 1,860.655 |
| Vert.x WebClient coroutines | 1,859.003 |
| Ktor CIO coroutines | 1,515.026 |
| HC5 classic coroutines | 1,216.306 |
CIO is still not near the top. But it is no longer the original 16.501 ops/s “this must be broken” result. Under the same conditions it reached 1,515.026 ops/s. At the same time, it left open questions around connection behavior and fixture compatibility.
The Selection Rules We Got
Section titled “The Selection Rules We Got”After this benchmark, choosing an io/http client became harder to hand-wave. At minimum, we
now have these starting points.
| Situation | Start with |
|---|---|
| Short local calls, sync API, simple usage | Java HttpClient, HC5 classic |
| Wait-heavy HTTP workload | OkHttp3/HC5/Java virtual-thread paths |
| Coroutine-native integration and non-blocking client matter most | HC5 async, Vert.x WebClient |
| Ktor-stack integration matters more | Ktor CIO, but remeasure long-run capacity with a dedicated fixture |
The point is not “one fastest client.” What io/http should provide is a set of measured paths
that can be selected by workload. This work made those choices concrete.
What Was Better Than the Numbers
Section titled “What Was Better Than the Numbers”Personally, the best result was not the 20x Vert.x improvement or a CIO comeback story. It was the choice to question the benchmark fixture before changing implementation code.
When I first saw the CIO numbers, I was disappointed. My first reaction was close to: “we added Ktor 3 and this is what we get?” That embarrassment forced us to look at the measuring conditions, and the final record became much better because of it.
A benchmark does more than prove “my code is fast.” Sometimes it tells you, “do not
trust the number you just saw.” This io/http work was closer to the second kind, and that made
it more useful.
Comments
Leave a note or reaction with your GitHub account.