
Interpreting Benchmark Results
Latest stable Based on Image release 1.0.0
The benchmark project is executable evidence, not a published dependency. Its reports compare Scrimage and libvips processing plus I/O and allocation boundaries available in 1.0.0.
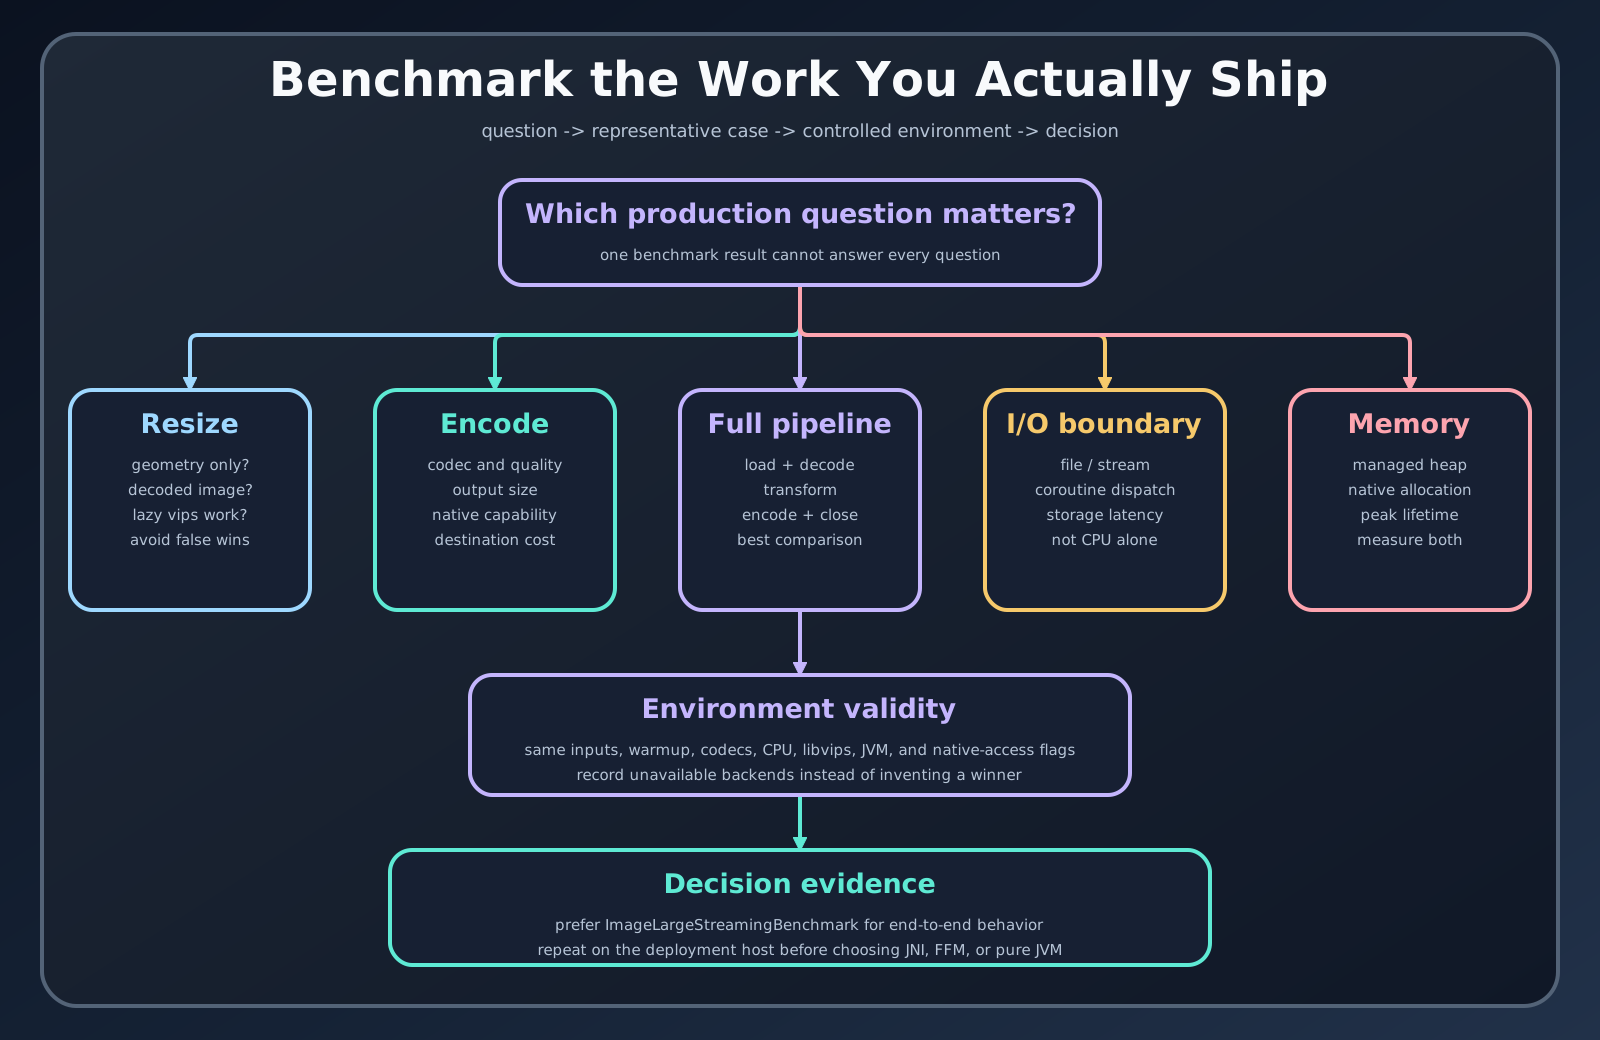
Know the measured operation
Section titled “Know the measured operation”Resize, encode, filter, chained pipeline, file I/O, large streaming, and memory profiles answer different questions. Read the benchmark class and fixture before using a chart. An encode row includes codec work; a resize row may not. Throughput and average-time metrics also point in opposite directions.
Preserve context
Section titled “Preserve context”Record JDK, operating system, CPU, libvips version, selected vips.impl, image dimensions and content, codec quality, warmups, iterations, forks, and metric unit. The repository reports are local measurements from their recorded environment. They do not prove cloud-instance, container, or concurrent-request behavior.
Turn a report into a decision
Section titled “Turn a report into a decision”- Find the report closest to the target operation.
- Reproduce its task on the intended JDK and native backend.
- Replace or add representative application fixtures.
- Add storage and framework boundaries.
- Measure latency percentiles, throughput, JVM heap, native memory, and output size.
- Choose the simplest backend that meets the budget.
Large streaming and memory reports deserve special care: managed-heap allocation does not account for all native memory, and an Okio API does not guarantee that decoded pixels remain streaming.
Reproduction
Section titled “Reproduction”The current benchmark module runs on JDK 25 and uses -Pvips.impl to select the backend. Historical JDK 21 rows may remain in the frozen release evidence; keep their labels and environment notes, and do not present them as the current runtime baseline. Run focused tasks from the release guide and keep raw JSON with the environment note. Do not mix results from changed source into a frozen manual claim.